OPEN ASSEMBLY
Experiments in Aesthetics and Politics






















Criminal Cartographies

A: A giant dildo piercing through Los Angeles!
T: No, seriously. What is it?
A: A rocket? I don’t know… A sperm?
M: A gun? A meteor? A train?
E: I don’t fucking know. A baseball bat?
D: It looks like a map… and a match burning down a neighborhood?
The Los Angeles Police Department featured this graphic in its internal promotional materials for Operation LASER, a data-driven crime mapping campaign utilized to “predict” future crime. The neon red laser’s crude three-dimensional rendering clashes with the seemingly rational objectivity of the map, which is organized into geometric sections and numerically labeled. Out of context, this shoddy collage reads as a meme about the Sith or extra-terrestrial invasion. It looks uncannily like something I might have made in Microsoft Paint when I was 12. Despite its aesthetic incongruence and humorous ambiguity, the LASER graphic is incredibly literal in its admission of the LAPD’s spatialized violence.
Operation Laser
Matyos Kidane of the Stop LAPD Spying Coalition included this graphic in a presentation he delivered at the Radical Hood Library in Los Angeles on October 11th of this year. The presentation, titled “Stop LAPD Spying: Behavioral Surveillance and the Assignment of Criminality,” was organized for CalArts’ Aesthetics and Politics Lecture Series under the theme of “deconstructing the police.” In his overview of surveillance architecture, Kidane featured several examples of the crime mapping mechanisms deployed by the police to enact racialized and gendered violence.

Image Description: A slide from the LAPD Mission Division’s internal PowerPoint presentation in March 2017. Image Source: Stop LAPD Spying Coalition. Automating Banishment. Accessed November 12, 2024. https://automatingbanishment.org/section/5-racial-terror-and-white-wealth-in-south-central/.
This particular poster was disclosed in a public records request made by Stop LAPD Spying in their extensive investigation into Operation LASER. In reflective blue and red gradient letters, the full-page design reads, “Attention All Personnel! LASER is here!” before expanding the acronym: “Los Angeles Strategic Extraction and Recovery.” Similar to the seemingly logical ordering of the map, the name of the campaign itself postures clinical impartiality. Coupled with the knowledge that this promotional poster was intended solely for the consumption of LAPD officers and employees, however, the playfully violent laser suggests that the police strategically sanitize their war campaigns against Los Angeles neighborhoods.
The poster’s hourglass-shaped map represents the LAPD’s Mission Division territory in San Fernando Valley, and the rectangular areas outlined in hot pink are LASER zones.1 During Operation LASER’s decade-long lifespan (2009-2019), these zones were determined through hot spot crime mapping, a process in which geographic data on past crimes were aggregated onto a map of the city using a Graphic Information System (GIS) and data analysis software. Under the pretense of crime prediction, neighborhoods with hot spots were targeted for heightened policing. For the crime of simply existing in these zones, individuals became subject to increased surveillance and harassment in the LAPD’s pursuit of “chronic offenders.”2 Though the Crime Intelligence Detail (CID) alleged to rely on “objective” data in the identification of these offenders, an audit revealed that even random interactions with police could wind people up on the watch list regardless of criminal activity.3 Unsurprisingly, this program disproportionately targeted Black, Brown, and poor communities.4
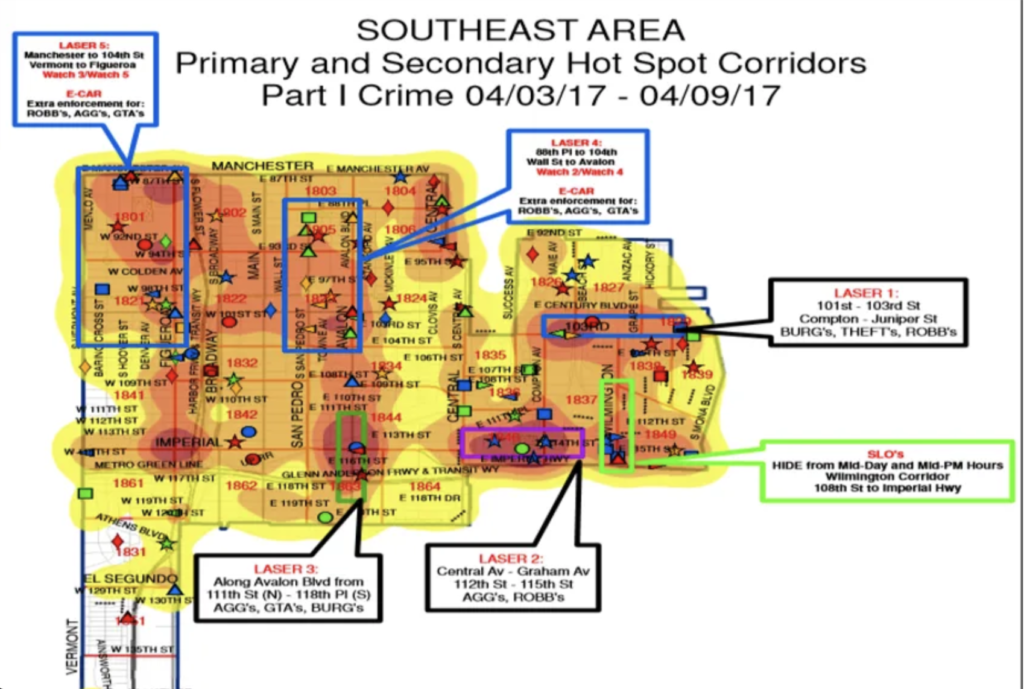
Image Description: An LAPD crime map utilizing hot spots to determine LASER zones. Image Source: Stop LAPD Spying Coalition. Architecture of Surveillance – Operation LASER. Accessed November 12, 2024. https://architectureofsurveillance.notion.site/Operation-LASER-ffff82e2b65681f99b1cd4ad2eaba5bd
The LAPD claimed that LASER operated with the precision of a medical device, extracting cancerous criminals from neighborhoods with no harm inflicted on the surrounding tissue.5 However, the program’s impact more closely resembled the ominously clumsy LASER promotional graphic: a largely out-of-scale weapon aggressively barrelling into an entire region. Neighborhoods and individuals labeled through LASER’s combination of data analysis and mapping were exposed not only to heightened surveillance and harassment, but also eviction, displacement, and premature death.6 The LAPD murdered Jesse Romero, Richard Richer, Kenny Watkins, Keith Bursey, Daniel Perez, Grechario Mack, and Robert Diaz in or near LASER zones.7 Thanks to the Stop LAPD Spying Coalition’s investigations into LASER, alongside public outcry and protests, the program was eventually subjected to board review and an audit ultimately led to its suspension.8
Crime Mapping
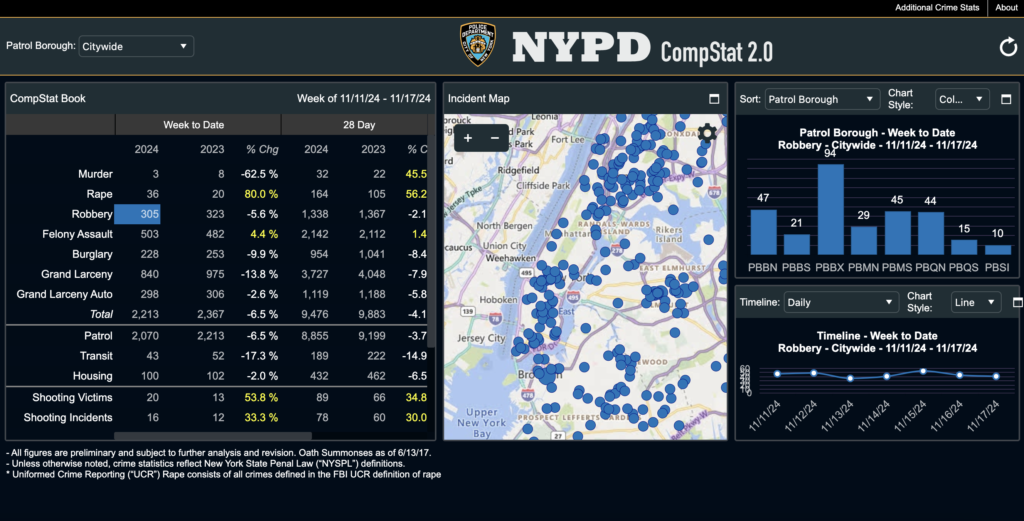
Image Description: The New York Police Department’s CompStat interface showing citywide robberies between November 11th and 17th, 2024. Accessed November 26, 2024. https://www.nyc.gov/site/nypd/stats/crime-statistics/compstat.page
Before and beyond Operation LASER, crime mapping has a long history, with its earliest recorded use dating back to 19th-century sociologists in France.9 Before the invention of digital mapping software, police created maps manually using pushpins to geographically represent crime data. With the introduction of GIS, police could more quickly and comprehensively utilize cartographic technology, such as hot spot mapping or kernel density estimation, to spatialize information. In the 1990s, New York City’s Police Chief Bill Bratton popularized data-driven policing in the form of CompStat.10 After becoming chief of the LAPD, he then pioneered the concept of “predictive” policing with the support of the National Institute of Justice and the Bureau of Justice.11 This concept became the backbone of campaigns like LASER.12 Beyond Operation LASER, data-driven crime mapping and the belief in the power to predict the future continue to shape the distribution of the LAPD’s attention and resources.
The language of police reform suggests that such technology minimizes racial, class, and gender bias through the use of objective algorithms and a focus on place over people. However, these algorithms are still programmed, tested, and operated in, by, and for a biased system. Furthermore, in a segregated city like Los Angeles, targeting a place often equates to targeting a specific demographic. After disproportionately patrolling and surveilling certain neighborhoods under the guise of objectivity, law enforcement agencies then utilize the inevitably higher recorded crime rates to reaffirm their assignment of criminality to racialized groups.13 Upgrading the technological efficiency of a historically racist and classist organization will not erase its violent methodologies or change its fundamental purpose. On the contrary, initiatives like Operation LASER demonstrate that these reforms provide more efficient means of fulfilling this purpose. As sociologist Ruha Benjamin reminds us, “That new tools are coded in old biases is surprising only if we equate technological innovation with social progress.”14
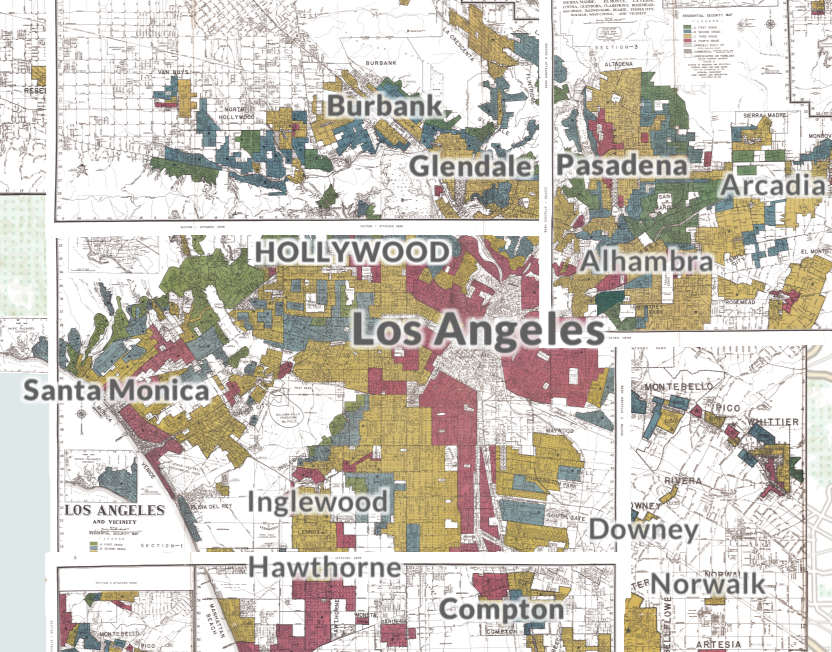
Image Description: Redlining map of Los Angeles showing “residential security grades” determined by the Home Owner’s Loan Corporation from 1935-40. Hazardous grades (shown in red) were often assigned to areas with higher percentages of non-white or “foreign” residents. Image Source: Nelson, Robert K., LaDale Winling, et al. “Mapping Inequality: Redlining in New Deal America.” Edited by Robert K. Nelson and Edward L. Ayers. American Panorama: An Atlas of United States History, 2023. https://dsl.richmond.edu/panorama/redlining
The LAPD’s historic and ongoing implementation of cartographic methods to record, visualize, enact, and justify violence raises several critical questions about the role of the map as an aesthetico-political tool: To what extent are maps grounded in reality versus the imaginary? Who has the power to manifest these imaginaries? And what are the counter-hegemonic potentials of mapmaking?
Spatial Imaginaries
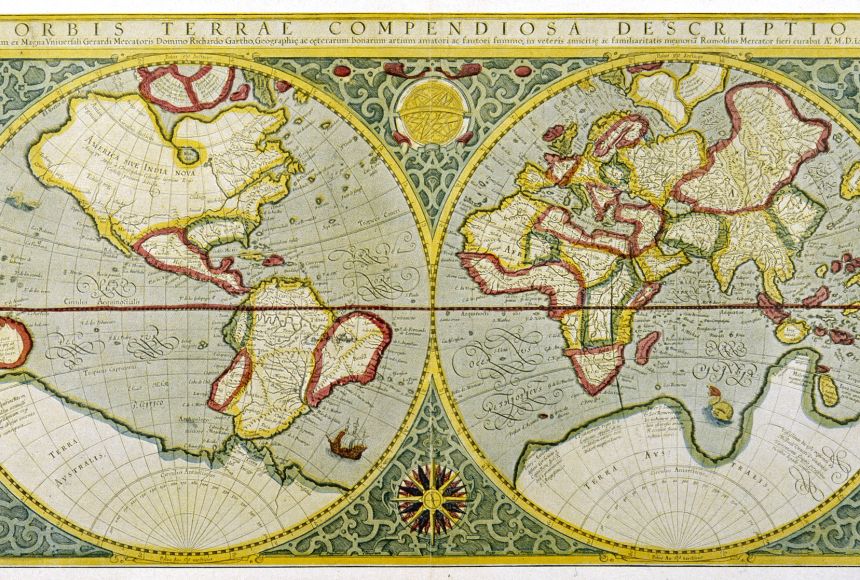
Image Description: Mercator World Map. 16th Century cartographer, Gerardus Mercator, utilized projections to render the globe two-dimensionally, which would distort its proportions. Image Source: Mary Evans/Science Source. Reproduced by National Geographic. “Gerardus Mercator.” Published October 19, 2023. https://education.nationalgeographic.org/resource/gerardus-mercator/.
Human-made maps have existed for centuries for various intents and purposes. Their use as an aesthetico-political tool is exemplified not only in the relatively recent phenomenon of the crime map, but also in the much older practice of statecraft. In Seeing Like a State, James C. Scott examines the State’s simplified organization of populations, language, urban planning, and laws for greater malleability and control.15 He identifies mapmaking, ranging from cadastral tax maps to modernist city planning, as one of many methods implicated in governmental pursuits of order.16 As Scott points out, this obsession with legibility homogenizes cultural and ecological landscapes, failing to capture the reality of social experience and harming people and places in the process.17
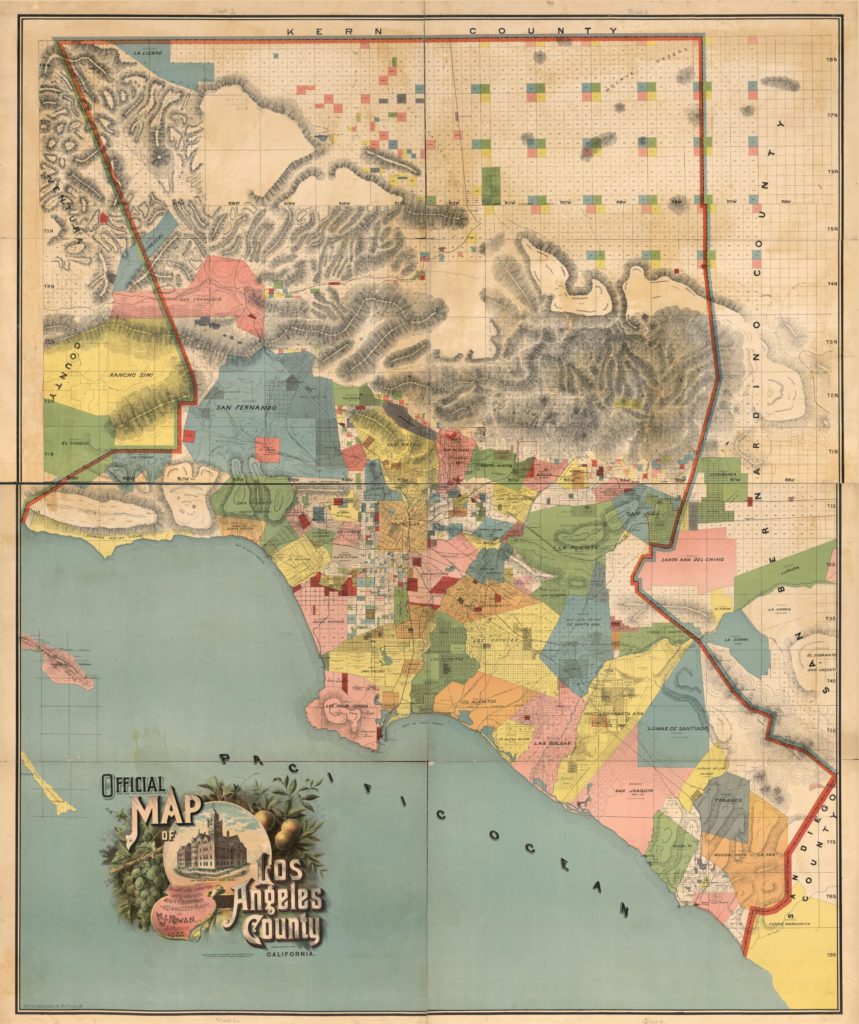
Image Description: Cadastral map of Los Angeles County (1888) featuring drainage, roads, railroads, ranchos, township & section lines, and land ownership. Image Source: Rowan, V. J., and Schmidt Label & Litho. Co. Official Map of Los Angeles County, California: Compiled under Instructions and by the Order of the Board of Supervisors of Los Angeles County. San Francisco, Cal.: Schmidt Label & Litho. Co, 1888. Map. Library of Congress. Accessed November 26, 2024. https://www.loc.gov/item/2012590104/.
Maps have also been deployed in the justification and execution of colonial enterprises. In Interdisciplinary Measures: Literature and the Future of Postcolonial Studies, Graham Huggan utilizes the discourses of poststructuralism and postcolonial studies to deconstruct cartography. “Cartographic discourse […] is also characterized by the discrepancy between authoritative status and approximative function, a discrepancy which marks out the ‘recognizable totality’ of the map as a manifestation of the desire for control rather than as an authenticating seal of coherence.”18 Colonization relies on the “mimetic fallacy” of maps, which reinscribe and hierarchically organize space to manifest the acquisition of land, the enforcement of colonial power, and the supremacy of the West.19 Crime mapping is an extension of statecraft and the legacy of colonialism, as it too feigns representational authority in pursuit of hegemonic order, despite its oversimplified, approximate, and imaginative qualities.
Norman Klein’s analysis of Los Angeles as a site of historical amnesia implies that city maps, despite their intent to record, are a technology of erasure.20 Cartography is an inherently incomplete and subjective practice.21 Why, for example, is the LAPD’s Mission District in the shape of a deformed hourglass? The seemingly arbitrary outlines of police districts, zip codes, voting precincts, and nation-state boundaries are almost fantastical, and would be comical if not so consequential.
Thematic maps are perhaps the most obvious testimony to this subjective incompleteness, given that they deliberately isolate a single phenomenon (e.g., population density, precipitation, crime) in space. Thematic isolation is useful in identifying and understanding specific phenomena, but cannot be mistaken for representational totality. Crime maps, for example, show only reported incidents of crime (a social construct unevenly applied to the population along racial, gender, and class lines) in a specific geographic area. What about statistically underreported crimes, like sexual assaults and hate crimes? What about the crimes committed by police? What happens if we overlay the map with data on access to healthcare, housing, and education? What if we zoom out of that area altogether?
Even reference maps, which provide more straightforward representations of geographic features (i.e., road maps), are subjective and incomplete. No aerial map can accurately or fully account for on-the-ground realities. What looks accessible on a map may be fortified and totally inaccessible. What appears blank is certainly not empty. The mapmaker draws from their subjective spatial experience and intent to decide what to make visible and what to hide–what is important and what is irrelevant. So how does crime mapping toe the line between the real and represented, and to what end?
The Production of Crime
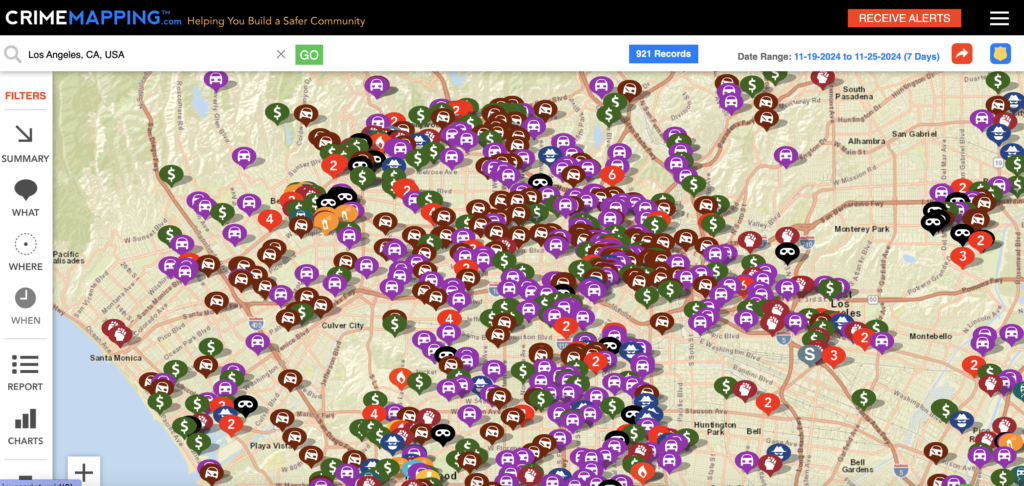
Image Description: Map of reported crimes in Los Angeles between November 19th and 25th, 2024. Image Source: CrimeMapping.com. Accessed November 26, 2024. https://www.crimemapping.com/
In The Production of Space, Henri Lefebvre argues for the significance of space in the manifestation of social relations and presents a triadic model for understanding these relations.22 The first category is perceived space, or spatial practice, which refers to the practical physical layout of space.23 The second category is conceived space, or representations of space, which is dominated by those with the power to manifest their spatial imagination, like urban planners, architects, and land developers.24 The third category is lived space, or representational space, where everyday people experience subjective interpretations of their spatial surroundings.25
Within the phenomenon of crime mapping, the police have the power to navigate fluidly through all three categories. Police officers experience subjective interpretations of their surroundings, including both places and people–interpretations which, no matter how fantastical (and racist), are taken at face value in legal proceedings, the justification of violence, and the collection/analysis of “objective” data later deployed in data-driven practices like LASER. Recorded perceptions are then implemented in the conceiving, or imagining of space, demonstrated by the figure of the “predictive” crime map. In turn, these representations of space are manifested into reality through the production of surveillance infrastructure that directly shapes the lived space and lives of everyday people–especially those who are systematically excluded from the powerful process of manifesting spatial imaginaries. The areas and people targeted by the police inevitably encounter the police at higher rates, yielding more data to add to the map and incorrectly legitimizing its authenticity. The cycle continues.
Crime mapping exemplifies the production of social space through the intersection of perception, conception, and lived experience that straddles the line between the real and the imagined. Deconstructing the imaginary aspect of cartography complicates the objectivity of policing by further problematizing the authenticity of data and even crime itself. “Official” numbers are a product of institutions, like governments, corporations, universities, non-profits, and the police–whose assumptions and interests determine the very premises and procedures for data collection.26 In Race After Technology, Ruha Benjamin illustrates how seemingly objective technologies, such as predictive algorithms, encode centuries of discrimination into the present and thus, the future.27 Khalil Gibran Muhammad’s research further identifies how 20th-century statisticians purposefully linked criminality with Blackness in the production of data that became foundational to “predictive” policing practices.28 As the Stop LAPD Spying Coalition succinctly states, “From slavery to sharecropping to the current prison industrial complex, crime has been constructed to criminalize Black, Brown, and poor people to generate revenue for the state and private entities.”29 They go on to point out actions that are not identified as criminal despite causing harm, such as lead poisoning and pollution–harms often perpetrated by corporations and militaries.30
Unfortunately, the crime map as an objective and effective policing tool is widely accepted and even championed by everyday people–especially those invested in securing their property and social position through partnerships with the police. Crime mapping is no longer a tool utilized primarily by law enforcement or sociologists, but is now in the hands of “the People” via platforms like crimemapping.com. The popular use of crime mapping fuels racialized and classist paranoia about rising crime rates, compounded by the technological power of GIS that collapses differentiation between the real and the represented through hyperrealistic digital interfaces.31 Exacerbated by manipulated aggregate statistics, sensational media reports, and seemingly objective crime maps, fear of crime motivates many in the so-called “progressive” city of Los Angeles to favor increased privatization, exclusion, policing, and incarceration in the name of security. Many are even willing to sacrifice their privacy to expand a panoptic architecture of surveillance.
Map Breaking
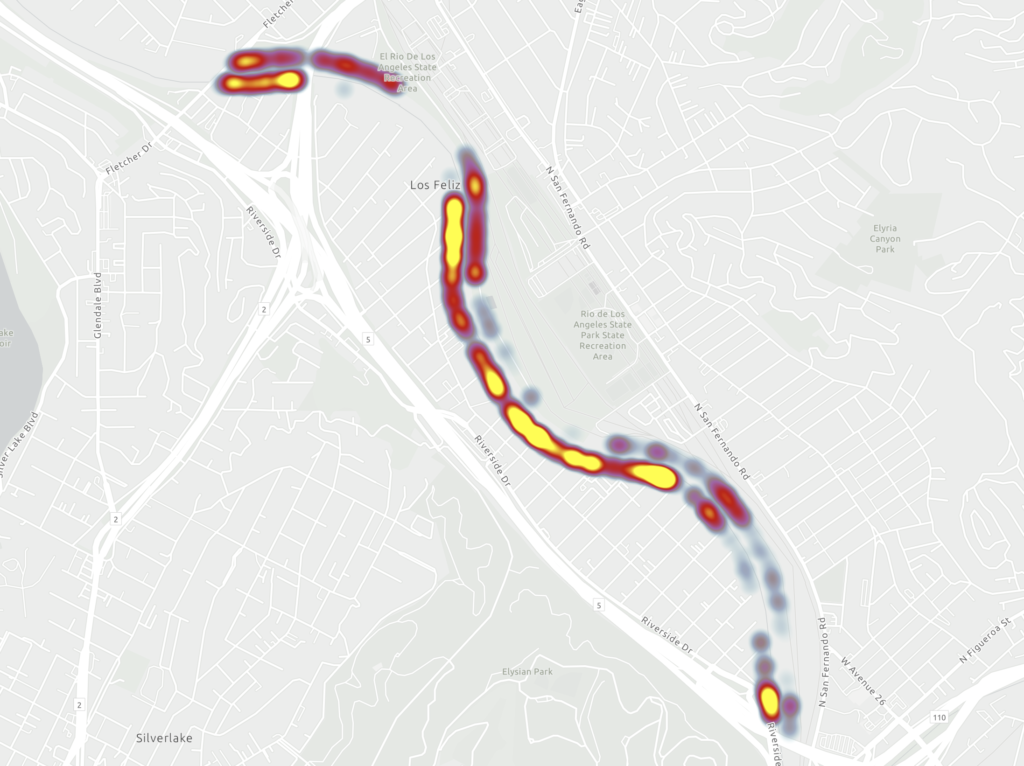
Image Description: This heat map of graffiti abatement toys subverts the concept of the crime map by employing its technologies to document not the “crime” of vandalism, but the stains of its erasure. Image Source: Tara Edwards. “Graffiti Abatement on the Los Angeles River in Elysian Valley.” Accessed November 25th. https://www.arcgis.com/apps/mapviewer/index.html?webmap=bd2f1d92e1d94ccf800b24e85ba313cd
Maps are not all bad, however–not even maps as an aesthetico-political tool, and not even criminal cartography. The blend of representation and imagination weaponized in hegemonic maps such as those created by the police can also be deployed against them via counter-mapping practices. Forensic Architecture, whose projects appear in both artistic and legal institutions, utilizes GIS to help visually reconstruct incidents where governments, militaries, and police have misrepresented events to cover up their wrongdoings. The New Inquiry created a predictive map of white-collar crime risk zones, challenging the racist foundations of crime and the fiction of prediction. The Stop LAPD Spying Coalition’s Automating Banishment Map similarly flips the script on crime mapping by exposing police violence made possible by programs like LASER.
“Criminal cartography” adopts an alternative meaning when looking at the maps made by “criminals” toward liberatory ends. Though such maps are seldom recorded in the official manner associated with cartography, they are stored and propagated through memory, oral history, and intracultural semiotics. For example, “criminal” cartographies may include the shared networks and routes of refugees, undocumented migrants, and escaped slaves–people breaking laws and transcending borders in pursuit of freedom and dignity.
Maps can also challenge the very notions of representation, mimesis, and accuracy that are implicated in colonial and police violence. Graham Huggan calls attention to map-breaking and map-making as a deconstructive process, whereby the map does not claim objective or subjective representation of reality.32 Instead, he proposes maps as “an expression of shifting ground between metaphors”–an open rather than a closed construct.33
Though many visual artists have employed and subverted cartographic methods as cultural commentary, I will conclude with a preliminary proposition of hip-hop graffiti as criminal cartography.34 In Los Angeles, graffiti writers explore the city by night in an active process of networked mapmaking with and through the variables of risk, visibility, legibility, and longevity.35 They transgress the legalistic lines on official maps and reclaim the power to conceive of space by manifesting their imaginaries on concrete. This re-appropriation of abstract space into lived space unites the real and imagined, producing “counter-spaces” that rely on partial unknowability.36 Jeff Ferrell suggests that the visual traces of graffiti inscribe such mappings onto the urban landscape: “Collectively, the accumulation of writers’ graffiti spots around the city forms a multidimensional urban map that encodes the shifting spatial ecology of the graffiti community, the varying practices and strategies of different writers and crews, and the status and visibility of each writer.”37 In doing so, graffiti writers invest in the perpetual process of map breaking and remaking.
As long as the LAPD draws maps to exercise control and enact violence, Angelenos will challenge these renderings through alternative mappings and spatial transformations.
***
Tara Edwards is an art educator and photographer interested in urban infrastructure, critical geography, and graffiti.
Endnotes
1 Stop LAPD Spying, Automating Banishment.
2 Stop LAPD Spying, “Operation LASER.”
3 Ibid.
4 Stop LAPD Spying, Before the Bullet Hits the Body.
5 Stop LAPD Spying, “LAPD Architecture of Surveillance.”
6 Stop LAPD Spying, Automating Banishment.
7 Stop LAPD Spying, “LAPD Architecture of Surveillance.”
8 Ibid.
9 Borden D. Dent, “Brief History of Crime Mapping.”
10Joel Hunt, “From Crime Mapping to Crime Forecasting.”
11 Ibid.
12 Stop LAPD Spying Coalition, “Predictive Policing.”
13 Stop LAPD Spying Coalition, Before the Bullet Hits the Body.
14 Ruha Benjamin, Race After Technology.
15 James C. Scott, Seeing Like a State.
16 Ibid.
17 Ibid.
18 Graham Huggan, “Decolonizing the Map,” 23.
19 Ibid.
20 Norman M. Klein, The History of Forgetting.
21 Conversations with Norman Klein and Ashley Hunt have been instrumental in shaping my exploration of maps.
22 Henri Lefebvre, The Production of Space.
23 Ibid.
24 Ibid.
25 Ibid.
26 Dan Bouk, Kevin Ackermann, and danah boyd, A Primer on Powerful Numbers.
27 Ruha Benjamin, Race After Technology.
28 Khalil Gibran Muhammad, The Condemnation of Blackness.
29 Stop LAPD Spying Coalition, Before the Bullet Hits the Body, 14.
30 Ibid.
31 Judith Kahl, “Mapping in Flusser, Deleuze, and Digital Technology.”
33 Graham Huggan, “Decolonizing the Map,” 29.
33 Ibid.
34 Inspired by ethnographer Jeff Ferrell’s analysis of graffiti writers as fluid cartographers and flâneurs.
35 Jeff Ferrell refers to the nuanced consideration of these variables as “spot theory.”
36 Edward Soja, “The Trialectics of Spatiality,” 53-82.
37Jeff Ferrell and Robert D. Weide, “Spot Theory,” 56.
Bibliography
Benjamin, Ruha. Race After Technology: Abolitionist Tools for the New Jim Code. Medford, MA: Polity Press, 2019.
Bouk, Dan, Kevin Ackermann, and danah boyd. A Primer on Powerful Numbers. New York: Data & Society Research Institute, 2022.
Chainey, Spencer. Understanding Crime: Analyzing the Geography of Crime. Redlands, CA: Esri Press, 2021.
Dent, Borden D. “Brief History of Crime Mapping.” In Atlas of Crime: Mapping the Criminal Landscape, edited by Linda S. Turnbull, Elaine Hallisey Hendrix, and Borden D. Dent, 4-21. Phoenix, AZ: Oryx Press, 2000.
Esri. “Law Enforcement Overview.” Esri. Accessed November 12, 2024. https://www.esri.com/en-us/industries/law-enforcement/overview.
Ferrell, Jeff, and Robert D. Weide. “Spot Theory.” City: Analysis of Urban Change, Theory, Action 14, no. 1-2 (2010): 48-62.
Huggan, Graham. “Decolonizing the Map: Postcolonialism, Poststructuralism and the Cartographic Connection.” In Interdisciplinary Measures: Literature and the Future of Postcolonial Studies, 21-33. Liverpool: Liverpool University Press, 2008.
Hunt, Joel. “Crime Mapping and Crime Forecasting: The Evolution of Place-Based Policing.” National Institute of Justice, July 10, 2019. Accessed November 12, 2024. https://nij.ojp.gov/topics/articles/crime-mapping-crime-forecasting-evolution-place-based-policing.
Intergovernmental Committee on Surveying and Mapping. “History of Mapping.” ICSM. Accessed November 12, 2024. https://www.icsm.gov.au/education/fundamentals-mapping/history-mapping.
Kahl, Judith. “Mapping in Flusser, Deleuze, and Digital Technology.” Flusser Studies 14 (2012).
Kidane, Matyos. “Stop LAPD Spying: Behavioral Surveillance and the Assignment of Criminality.” Lecture at the Radical Hood Library, Los Angeles, October 11, 2024.
Klein, Norman M. The History of Forgetting: Los Angeles and the Erasure of Memory. Verso, 2008.
Lefebvre, Henri. The Production of Space. Translated by Donald Nicholson-Smith. Oxford: Blackwell, 1991.
Muhammad, Khalil Gibran. The Condemnation of Blackness: Race, Crime, and the Making of Modern Urban America. Cambridge, MA: Harvard University Press, 2019.
Rowan, V. J, and Schmidt Label & Litho. Co. Official map of Los Angeles County, California: compiled under instructions and by the order of the Board of Supervisors of Los Angeles County. San Francisco, Cal.: Schmidt Label & Litho. Co, 1888. Map. https://www.loc.gov/item/2012590104/.
Scott, James C. Seeing Like a State: How Certain Schemes to Improve the Human Condition Have Failed. New Haven: Yale University Press, 2020.
Soja, Edward. “The Trialectics of Spatiality.” In Thirdspace: Journeys to Los Angeles and Other Real-and-Imagined Places, 1st ed., 53-82. Cambridge, MA: Blackwell Publishers, 1996.
Stop LAPD Spying Coalition. Automating Banishment: The Surveillance and Policing of Looted Land. Accessed November 13, 2024. https://automatingbanishment.org/section/5-racial-terror-and-white-wealth-in-south-central/.
Stop LAPD Spying Coalition. Before the Bullet Hits the Body: Dismantling Predictive Policing in Los Angeles. May 8, 2018. https://stoplapdspying.org/wp-content/uploads/2018/05/Before-the-Bullet-Hits-the-Body-May-8-2018.pdf.
Stop LAPD Spying Coalition. “LAPD Architecture of Surveillance.” Architecture of Surveillance. Accessed November 12, 2024. https://architectureofsurveillance.notion.site/LAPD-Architecture-of-Surveillance-106f82e2b6568044829ed53806491be1.
Stop LAPD Spying Coalition. “Operation LASER.” Architecture of Surveillance. Accessed November 12, 2024. https://architectureofsurveillance.notion.site/Operation-LASER-ffff82e2b65681f99b1cd4ad2eaba5bd.
Stop LAPD Spying Coalition. “Predictive Policing.” Architecture of Surveillance. Accessed November 12, 2024. https://architectureofsurveillance.notion.site/Predictive-Policing-ffff82e2b65681988372e1c5db03f2d6
U.S. Department of Justice, Office for Victims of Crime. “Using Geographic Information Systems (GIS) to Map Crime and Provide Information to the Community.” Office for Victims of Crime Resource Center. Accessed November 12, 2024. https://www.ncjrs.gov/ovc_archives/reports/geoinfosys2003/cm3b.html.
Weizman, Eyal. The Politics of Verticality: The Architecture of Israeli Occupation in the West Bank. Birkbeck, University of London, 2008.
